2019-20 Winter Forecast: A State-By-State Breakdown
Introduction
Each fall, Firsthand Weather releases a winter forecast to explain the large-scale atmospheric and oceanic features that could drive temperature and precipitation patterns during the winter months across the United States. Our goal is to provide you with an overview of what you should expect conditions to be on average. Thus, temperature and precipitation could vary greatly over the three-month winter season, depending on your location. We don’t predict exact snowfall/rainfall totals in our seasonal products. We simply want to inform our viewers if our analysis suggests their region will have anomalous conditions (e.g. above average temperatures, above-average snowfall, etc.). Due to the nature of seasonal forecasting, we may eventually have to modify our original winter forecast for some regions. If that occurs, we will thoroughly explain which aspects of the forecast were wrong and why. Though we have put much time and effort into this winter forecast, we want any errors that we make to be a learning experience for all of you and for us, as well.
Firsthand Weather’s official 2019-20 Winter Forecast
Technical discussion about analog selection
Before writing any seasonal forecast product, we perform an analysis to select previous winters that appear to be similar to the upcoming one. We refer to those similar winter seasons as analogs. One method that we use to accomplish this task is to select similar years based on sea surface temperatures (SST) anomalies in the north Atlantic and Pacific Oceans. An anomaly is simply a departure from average of some value (e.g. temperature, precipitation, etc.) at a given time or over some specified period. Some years, moderate to strong El Niño or La Niña conditions are evident, which makes it a bit easier to find years that had similar oceanic and atmospheric conditions. But as shown by SST anomalies over the last month, there really is no strong El Niño or La Niña signal (Figure 1). Strictly based on oceanic conditions, there are some hints of an El Niño Modoki, represented by above average SSTs across the central equatorial Pacific. The most noteworthy feature is the ‘warm blob’ that has persisted south of the Gulf of Alaska, reminiscent of a feature present during the 2013-14 and 2014-15 winters. Also, sea ice extent has recently been at record lows across the Chukchi Sea between Alaska and Russia. Though climate change likely increases the odds of such events occurring, we cannot ignore atmospheric and oceanic conditions elsewhere that could have forced low sea ice extent in the region relative to recent years. We care about Pacific oceanic and atmospheric conditions because those conditions can strongly impact temperature and precipitation patterns over the United States.
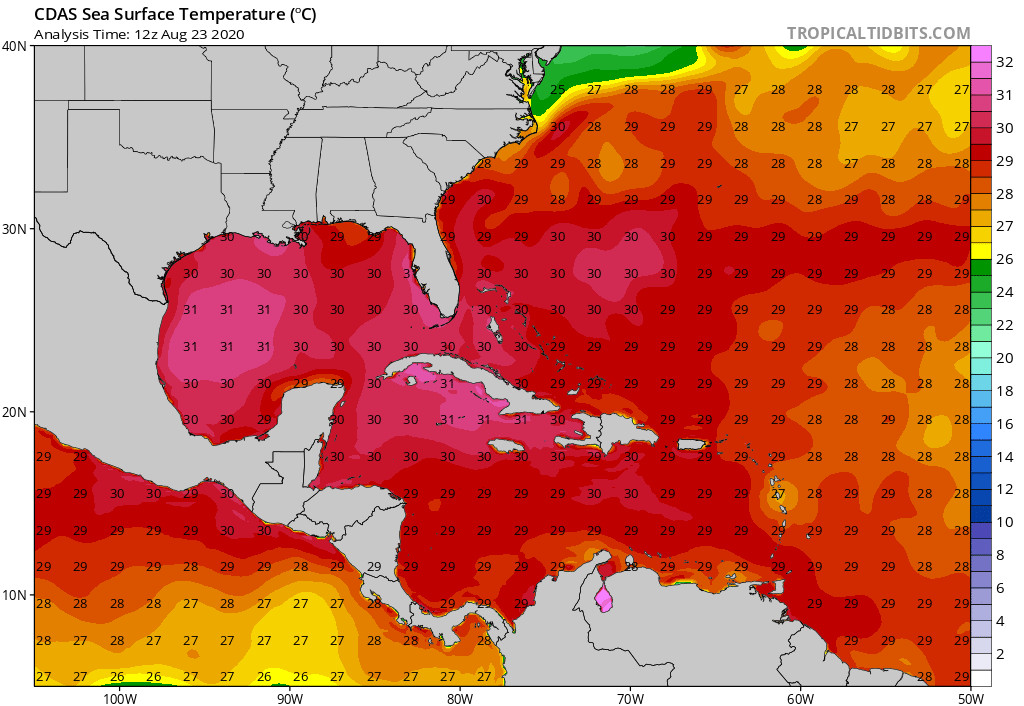
Figure 1: Latest monthly-averaged SST anomalies
For a few sentences, we’re about to get a little technical, but we’ll attempt to explain this as clearly as possible. We decided to deconstruct SST anomalies using empirical orthogonal functions (EOFs) to identify modes of SST anomaly variability. When we’re talking about SST variability, we’re simply referring to how much SSTs vary over some period of time. El Niño and La Niña explain one mode of SST variability in the Pacific. However, some modes of variability may be difficult to identify without using a statistical method like EOFs to pull them out, which we can then use to find years that had similar SST patterns. A more obscure mode of variability in the Pacific is represented by the ‘warm blob’ over the northeast Pacific. When the warm blob exists, SSTs are usually above average across the west-central equatorial Pacific, as well. We can actually outline this signature in the monthly SST anomalies in the first figure. Since we know that conditions along the equatorial Pacific can affect atmospheric conditions in the U.S. and that the warm blob may be connected to the equatorial Pacific, we simply can’t ignore the relatively high SSTs in the northeast Pacific. Furthermore, if the warm blob persists throughout the winter, it’s not unreasonable to suggest that it could strengthen large-scale ridging over the region; thus, having an even greater effect on U.S. winter conditions. We’ll provide a follow-up article or video to break down our methods further in a couple of weeks.
If the last paragraph was a bit too technical for your liking, we promise that we’re finally going to share our analog years, which will lead into the actual forecast. We initially pinpointed three winters where the northeast Pacific warm blob persisted through most of the winter (1956-57, 1967-68, 2013-14). The issue with using the 1956-57 winter as an analog was that there was a ring of cooler SSTs extended from the Bering Sea to the Gulf of Alaska/West Coast and over to Hawaii (Figure 2). Although the northeast Pacific warm pool existed that winter, another mode of SST/atmospheric variability, known as the Pacific Decadal Oscillation (PDO), was negative. Thus, Southeast ridging dominated that winter, causing temperatures to remain well-above average across the Southeast and Southern Plains. On the other hand, the Pacific Northwest and the northern Great Plains had below average temperatures. At least based on current projections, there’s no reason to believe that the PDO will go into a negative phase this winter, which only leaves us with the 1967-68 and 2013-14 winters (Figure 3) as analogs.
Figure 2: A composite of SST anomalies during the 1956-57 winter
Figure 3: A composite of SST anomalies during the 2013-14 winter
We really needed more analog years to go by since a sample size of two is simply too small. Since current evidence suggested that the Pacific warm blob will persist through the winter, we decided to pull the top five February’s that had a northeast Pacific warm pool and a neutral or positive PDO. We didn’t eyeball this. We used EOFs and principal component time series to select those cases. Those five Februarys included: 1963, 2014, 1968, 2015, and 1930. When making a composite of SST anomalies of those five winters from December-February, we found that anomalous warming existed over the northeast Pacific, along with no evident PDO signature (Figure 4). Of course, the reality is that SSTs are considerably higher today across the North Pacific compared to some of our analog years, but given the nature of this science, we have to work with what we’ve got and learn from there!
Figure 4: A composite of SST anomalies during five analog years
We made a 500mb anomaly height field composite using our five analogs years to identify the large-scale characteristics most prominent during those winters (Figure 5). It appears that ridging likely existed along the West Coast and extended into Alaska and the Bering Sea. If we take those same years and plot surface temperature anomaly composites, we find that those winters were characterized by widespread cold across the eastern two-thirds of the nation and above average temperatures across the southwestern U.S and Alaska (Figure 6 & 7). We can’t discount the possibility that the spatial distribution of SST anomalies in the North Pacific will change markedly throughout this winter. However, our current findings, assuming that SST anomalies in the North Pacific remain similar throughout this winter, suggest that we could experience a winter similar to 2013-14. If sudden changes in Pacific SSTs do occur, the likelihood of our winter forecast verifying in some regions will greatly decrease.
Figure 5: A composite of 500mb height anomalies during five analog years
Figure 6: A composite of 2m (surface) temperature anomalies during five analog years
Figure 7: Same as Figure 6 except focused over the Lower 48
Become a Facebook Supporter
If you would really like to learn how we put together our seasonal and long-range forecasts and you enjoy knowing the why behind the forecast, consider joining our Facebook Supporter Group. Along with weekly short-range and long-range forecast discussions, we will dissect our winter forecast much further in the Supporter Group. If you sign up before December 15th, we will provide you with an updated and detailed winter forecast for your exact location later this winter. The cost is only $4.99 a month, and you can cancel anytime if you decide this service isn’t for you! You can even use PayPal to pay your monthly subscription. After December 31st, we will no longer take any new subscribers, so signup while you still can!
2019-20 Winter Forecast Regional Breakdown
California, Nevada: Drought conditions have already begun to develop across most of California and Nevada, except for the extreme northern part of each state. Although the Pacific and subtropical jets should remain active through early December, the upcoming uptick in rainfall and mountain snow for the northern half of these states will likely not persist through January and February. Throughout the winter, large-scale ridging should become a dominant feature along and just off the West Coast and into Alaska. Therefore, this should keep the primary storm track well to the north of the region. Furthermore, temperatures should end up above average for the region, even despite the possibility of early-season cold air intrusions. Concerns remain that the lack of precipitation this winter could result in an ongoing and increased wildfire threat this spring.
Washington, Oregon, Idaho, Montana: Although the active Pacific jet could usher in a few noteworthy storm systems early in the season, the placement of the ridge should eventually prevent most systems from moving into Washington and Oregon in a west-to-east fashion. Instead, the ridge will result in shortwaves dropping down into Montana in a northwest-to-southeast fashion. Now, here’s a disclaimer. If the ridge builds farther offshore or is more zonal in nature, then the pattern would be much more active across the Pacific Northwest. However, our current findings do not suggest this will occur. We expect temperatures to be average to above average across Washington, Oregon, and Idaho. Precipitation should remain below-average for most of the winter across the three states, and the Cascades and northern Rockies will have below-average snowfall for the season. The eastern two-thirds of Montana will likely be the exception to the rule. We expect precipitation/snowfall, east of the Rockies, to be around average for that part of the state, and temperatures to be average to below-average.
Wyoming, Utah, Colorado: Temperatures will generally run above average to the west of the Rockies, while temperatures will be average to below average along and east of the Rockies. Although we expect the early winter to start off more active than the middle and end will be, snowfall totals will be slightly above average along and east of the Rockies, including for Denver, CO and Cheyenne, WY. The mean axis of the western ridge will likely remain positioned far enough west to prevent conditions from drying out too much later in the season from the Rockies eastward. Thus, we don’t expect a situation similar to the 2014-15 winter when large-scale ridging was positioned just too far east over the West to allow for a really good ski season over the Rockies. However, a lack of precipitation will exacerbate already-existing drought conditions west of the Rockies, especially over Utah. We expect snowfall totals to run below-average across Salt Lake City, UT and for most of the state.
Arizona, New Mexico: Drought conditions still exist over both states, with some regions at severe or even extreme drought. Despite the tendency for ridging over the West, a split-flow pattern likely will allow storm systems to pass through and strengthen over the region early in the winter. However, the winter should progressively get drier from mid-to-late season, worsening drought conditions for most. We expect precipitation to be average to below average, except across the northern half of New Mexico. Snowfall totals across the Rockies and outside of the mountains into eastern New Mexico should run around average or even slightly above average. Temperatures will generally run around average to slightly above average across the rest of New Mexico, while they will run mostly above average across Arizona.
Missouri, Illinois, Indiana, Ohio, Kentucky: Almost this entire region will experience temperatures either below average or well-below average. Large-scale troughing will become a dominant feature over the area this winter, allowing numerous rounds of Arctic air to flow into the region. Early in the season, a tendency for ridging across the Southeast and an active subtropical jet will provide a few opportunities for heavy precipitation events (rain and/or snow). Unlike last year, Southeast ridging will likely not build as strongly into the region; thus, temperatures will not have the tendency to run above average for long periods of time. Snowfall totals for the winter should at least end up around average with many areas experiencing above average snowfall. Overall, this winter will be characterized as active and consistently cold (relative to average) across these states. Conditions will be especially frigid over places like Chicago, IL.
Arkansas, Louisiana, Tennessee, Mississippi, Alabama, Georgia, North Carolina, South Carolina, Florida: Many in this region will have their first opportunity in several winters to experience at least several weeks of anomalous cold weather, if not a bit longer. Although early-season Southeast ridging could make it challenging for many areas outside of the Appalachians to receive frozen precipitation at first, that should begin to change either in late December or early January. The primary storm track early in the season should remain west and north of the region, allowing for several periods of rainy conditions. Thus, there will be alternating periods of cool/wet and cold/dry conditions during that time. As the season progresses, a tendency for large-scale troughing over the eastern U.S. will allow several rounds of Arctic air to intrude into the region. Temperatures should run below-average across most of this area, except over the Florida peninsula around and south of Orlando. For most regions that experience frozen precipitation every few years or more often, snowfall and/or ice accumulations should run average to above average. The Appalachians will likely experience above-average snowfall.
North Dakota, South Dakota, Nebraska, Iowa, Minnesota, Wisconsin, Michigan: Although it generally goes without saying that the northern Great Plains, Midwest, and Great Lakes will have a cold winter, these regions will experience conditions much colder than average. The Great Lakes region will especially experience dangerous cold and will probably end up with the largest departure from average temperatures when all is said and done. The pattern will support ample lake-effect snow, especially early in the season when the lakes contain less ice-cover. Early on, the primary storm track will be oriented from the middle Great Plains to the Great Lakes, which will place most of these states on the snowy side of any system that passes through the region. Eventually, large-scale troughing will become a dominate feature, and the mean trough axis should position this region to receive snow relatively often from northern stream systems. Thus, snowfall totals should at least reach average levels, if not above average. Those locations prone to lake-effect snowfall should have above-average snowfall this season.
Kansas, Oklahoma, Texas: The panhandles of Texas and Oklahoma, along with most of Kansas will have several good opportunities to receive snowfall early in the season, and such an early start to winter may allow that region to end up with above average snowfall for the winter. Multiple intrusions of Arctic cold should make it into the area at the beginning of the season, and colder conditions should persist through most of the winter, even if temperatures move back closer to average later in the winter. Yes, that includes the entire state of Texas. Areas closer to the Red River, including regions as far south as Dallas, TX, could have a couple of really good shots at receiving accumulating snow/ice later this season. Thus, we expect average to above-average snowfall across much of Oklahoma and for areas along a line that extends as far south as Dallas, even if liquid-equivalent precipitation remains around average.
West Virginia, Virginia, Maryland, Delaware, New Jersey: This region will have a decent shot at snowfall this year, and conditions should remain consistently colder than average due to large-scale troughing. We don’t expect southeast ridging to be as strong as last winter; thus, expect numerous intrusions of bitter cold to make it into the region this winter. Interior regions closer to the mountains will experience snowfall early this year, primarily due to the likelihood of northwest flow events. Early on, the storm track will orient itself from the Great Plains to the Great Lakes/New England region, which could hurt snow chances at the beginning of the season. However, by the end of the season, snowfall totals should at least approach average values for most locations. In order for the Mid-Atlantic coastal regions to experience well-above average snowfall totals, blocking (ridging) generally needs to occur over Greenland for an extended period of time (e.g. 2009-10 winter). Unfortunately, predicting such a block remains challenging and is something we’ll have to monitor throughout the winter.
Pennsylvania, New York, Connecticut, Massachusetts, Rhode Island, Vermont, New Hampshire, Maine: We expect this entire region to experience temperatures below average this winter; however, the largest departures from average will likely occur closer to the Great Lakes in New York and Pennsylvania. Regions prone to lake-effect snow will experience above average snowfall this winter, with the bulk of the lake-effect snow falling early in the season when the lakes will be mostly ice-free. Although liquid-equivalent precipitation may end up closer to average for most locations, the cumulative effect of storm systems passing through the region from the Great Plains early in the season, along with northern stream systems bringing additional snow, should allow snowfall totals to reach above-average levels for interior regions. Closer to the coast from around Philadelphia to New York City to Boston, snowfall totals will come closer to average; however, temperatures will still end up below average due to persistent troughing over the region.
Follow us on social media and signup for our newsletter
Although we will keep our website updated with our latest forecasts, consider liking us on Facebook where we often post multiple, shorter weather discussions per day. Also, we plan on starting up our newsletter again soon, so make sure that you sign up and receive a confirmation email to get the newsletter.